Digital Twinzer
Digital Twinzer
The application represents a vineyard as a digital twin that provides winegrowers with comprehensive and up-to-date information. This enables them to take targeted measures to improve the vines in good time and on the basis of tangible data.
User Research
Concept
UX Design
Visual Design
Prototyping

Info
Time frame
March 2023 - July 2023
Context
Lean Design Project, Hochschule für Gestaltung
Tools
Figma, Protopie, Teachable machine
Teammembers
Konrad Kleisinger, Mikias Ehrmann, Fabian Buchenberger
Problem
In Europe's vineyards alone, winegrowers apply almost 90.000 tonnes of fungal toxins every year.
This is almost 60% of the total amount used in agriculture as a whole. Although the total area of vineyards in the EU accounts for only 2% compared to other crops.
This means that winegrowers use around 73 times more spraying agents than the rest of the agricultural sector.


Research
To gain a basic understanding of the work of an winemaker, we conducted a lot of desk research. Mainly through the internet and, you read it right, a book called "Hobby Winzer".
Afterward, we aimed to connect with as many winemakers as possible to gain insights from their daily experiences. Fortunately, we found several who were willing to assist us through online and in-person interviews. These conversations were incredibly valuable and allowed us to to create empathy maps, personas and identify key pain points.
Pain points
01
Preventive pest control
You have to spray preventively and not only when an infestation is present
02
Data collection
Too little and too imprecise data from the vineyard to make reliable forecasts
03
Documentation
There is a lack of opportunities to document abnormalities in the vineyard
Then, we used creative techniques like Crazy 8s and sketching to ideate features and concepts. After that we worked to form a balanced overall concept. In this process, methods like the MoSCoW method were very helpful in evaluating and prioritizing features. By the end, we had developed a shared understanding of the project and documented this with a "question zero."
Concept
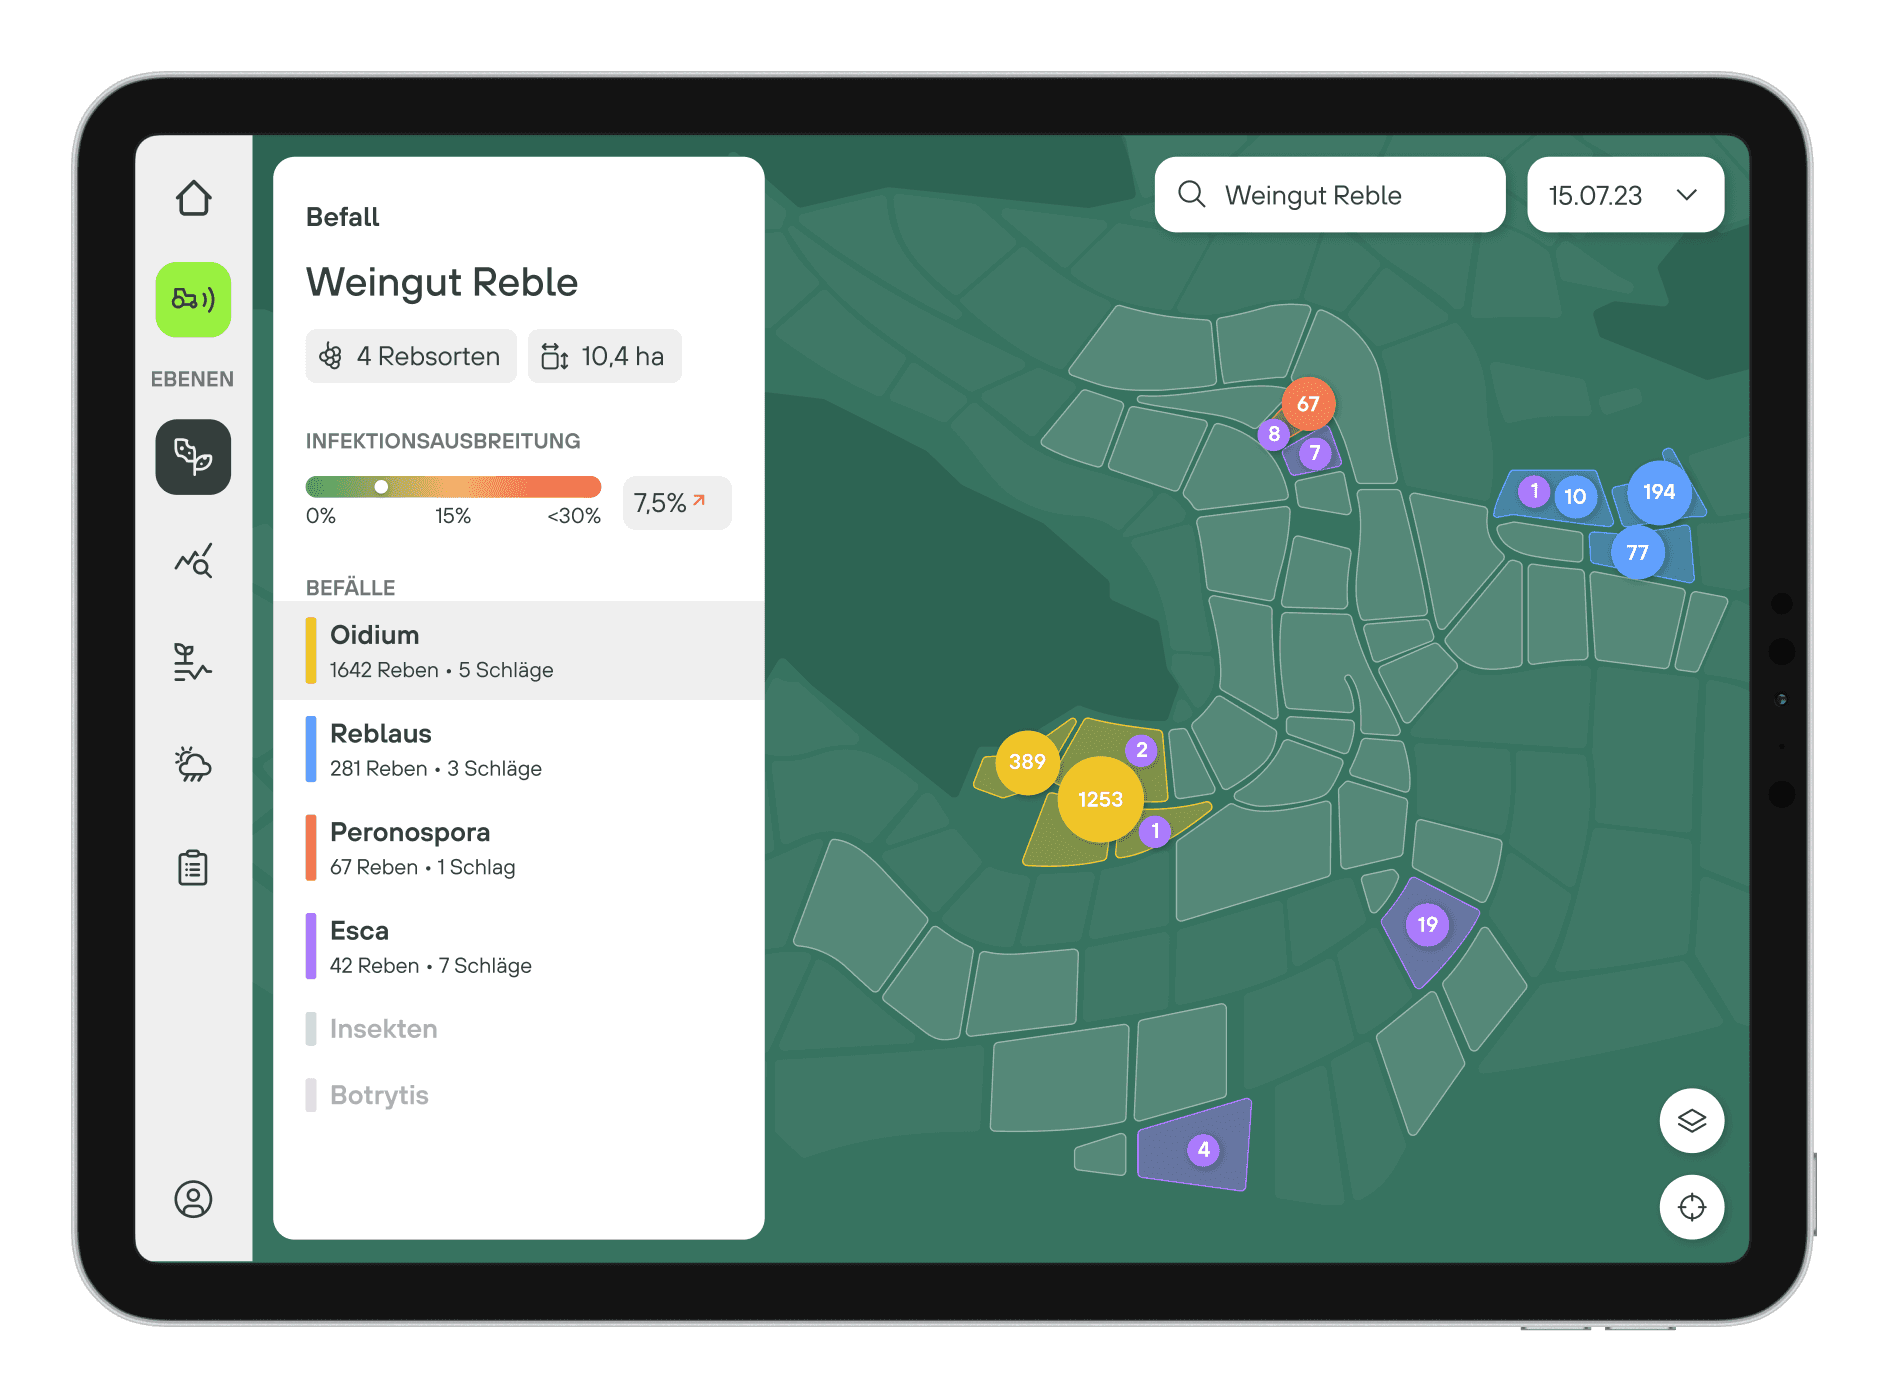
The solution is a comprehensive digital application that records, analyses and visualises data from camera images, LiDAR sensors and satellites and makes it available to winegrowers in a single program. These sensors are attached to the tractor and collect data simultaneously alongside other activities in the vineyard. The vines are analysed for various diseases and their general state of health is determined.
This gives the winegrower both an early and holistic overview of the weak points in his vineyard and allows him to use the data collected to take targeted measures to tackle or rectify them.

Final Screens

Home Screen
The start screen displays the most important information about the vineyard and allows you to quickly access key areas of the app

Scan Start
During the daily work in the vineyard, the sensors attached to the tractor collect new information about the vineyard. As soon as the winegrower reaches a new field, he can start the scan.

ongoing Scan
During the scan, the winegrower receives live feedback on the progress of the scan and the health of his vines.